Analysing Azure AD Logs with Log Analytics
Log Analytics is part of Azure and is a great solution for analysing and interrogating logs across a huge assortment of Azure services. In this post I am going to demonstrate redirecting Azure AD logs to Log Analytics, and then build a dashboard showing various data from those logs. You will need to have Azure AD P1 or P2 licensing in order to redirect the Azure AD logs, and an Azure subscription to create the workspace.
Configure Log Analytics
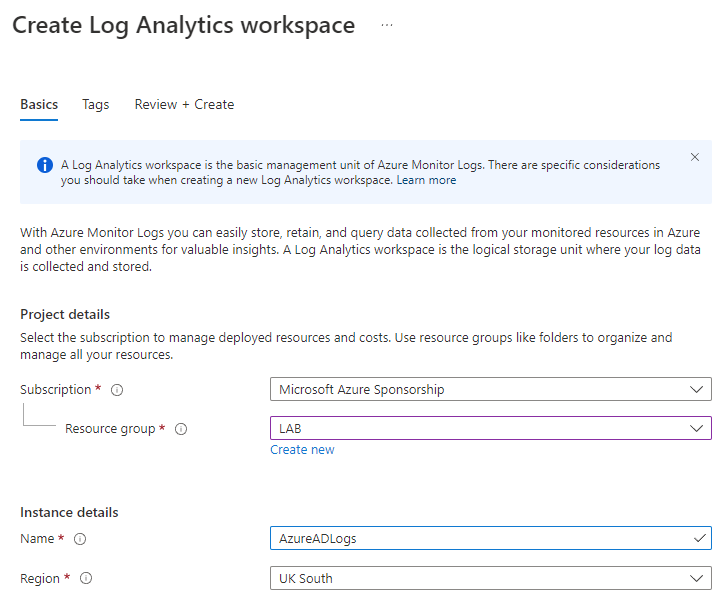
The first step here is to create a Log Analytics Workspace. Go to Azure Portal > Log Analytics Workspaces and click on Create.
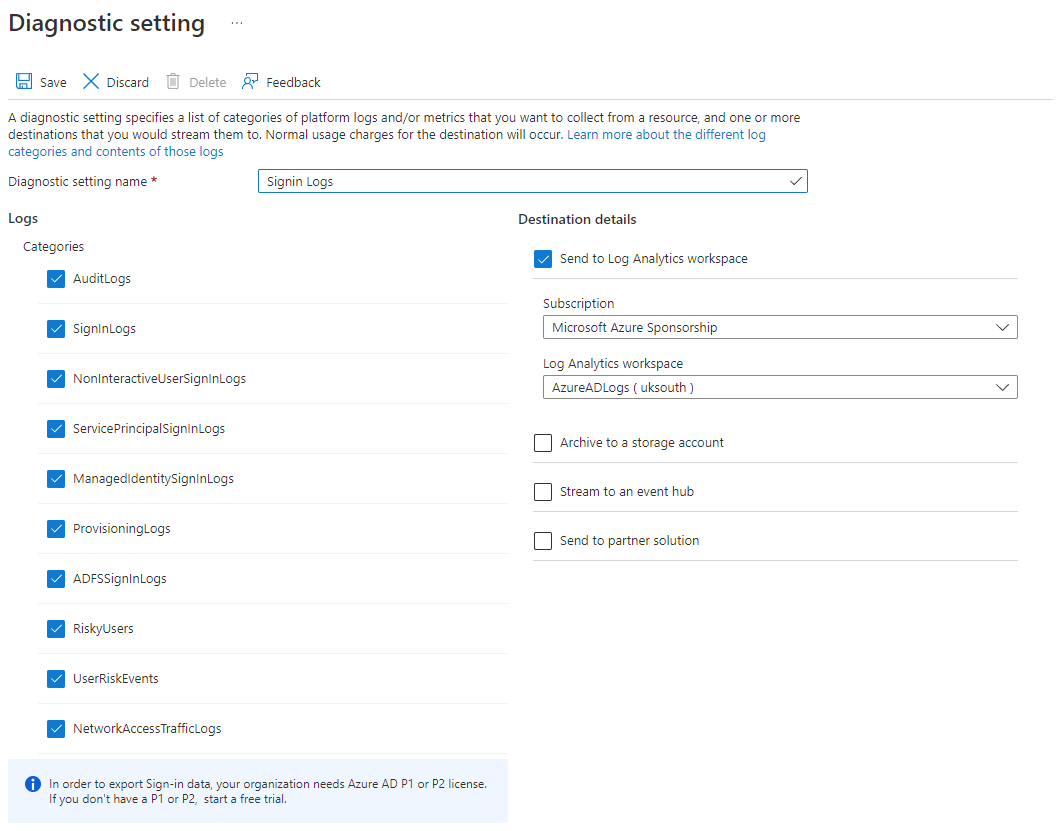
Once this step has completed, go to the service you wish to link, in this case Azure AD. Look for an item on the menu called Diagnostic settings and click on it. Next click Add diagnostic setting to configure the collection of data. You will notice the Diagnostic Settings screen appears on a lot of different services across Azure, if you want to configure a different service to redirect its logs to Log Analytics it is the same process.
For Azure AD, this data includes:
- AuditLogs
- SignInLogs
- NonInteractiveUserSignInLogs
- ServicePrincipalSignInLogs
- ManagedIdentitySignInLogs
- ProvisioningLogs
- ADFSSignInLogs
- RiskyUsers
- UserRiskEvents
- NetworkAccessTrafficLogs.
Select all of the log types and direct the data towards your Log Analytics workspace, then click Save. While we've picked all the categories for this demonstration, make sure you don't pick more than you need as some of the categories can generate a lot of data, and run up the cost.
Built-In Workbooks
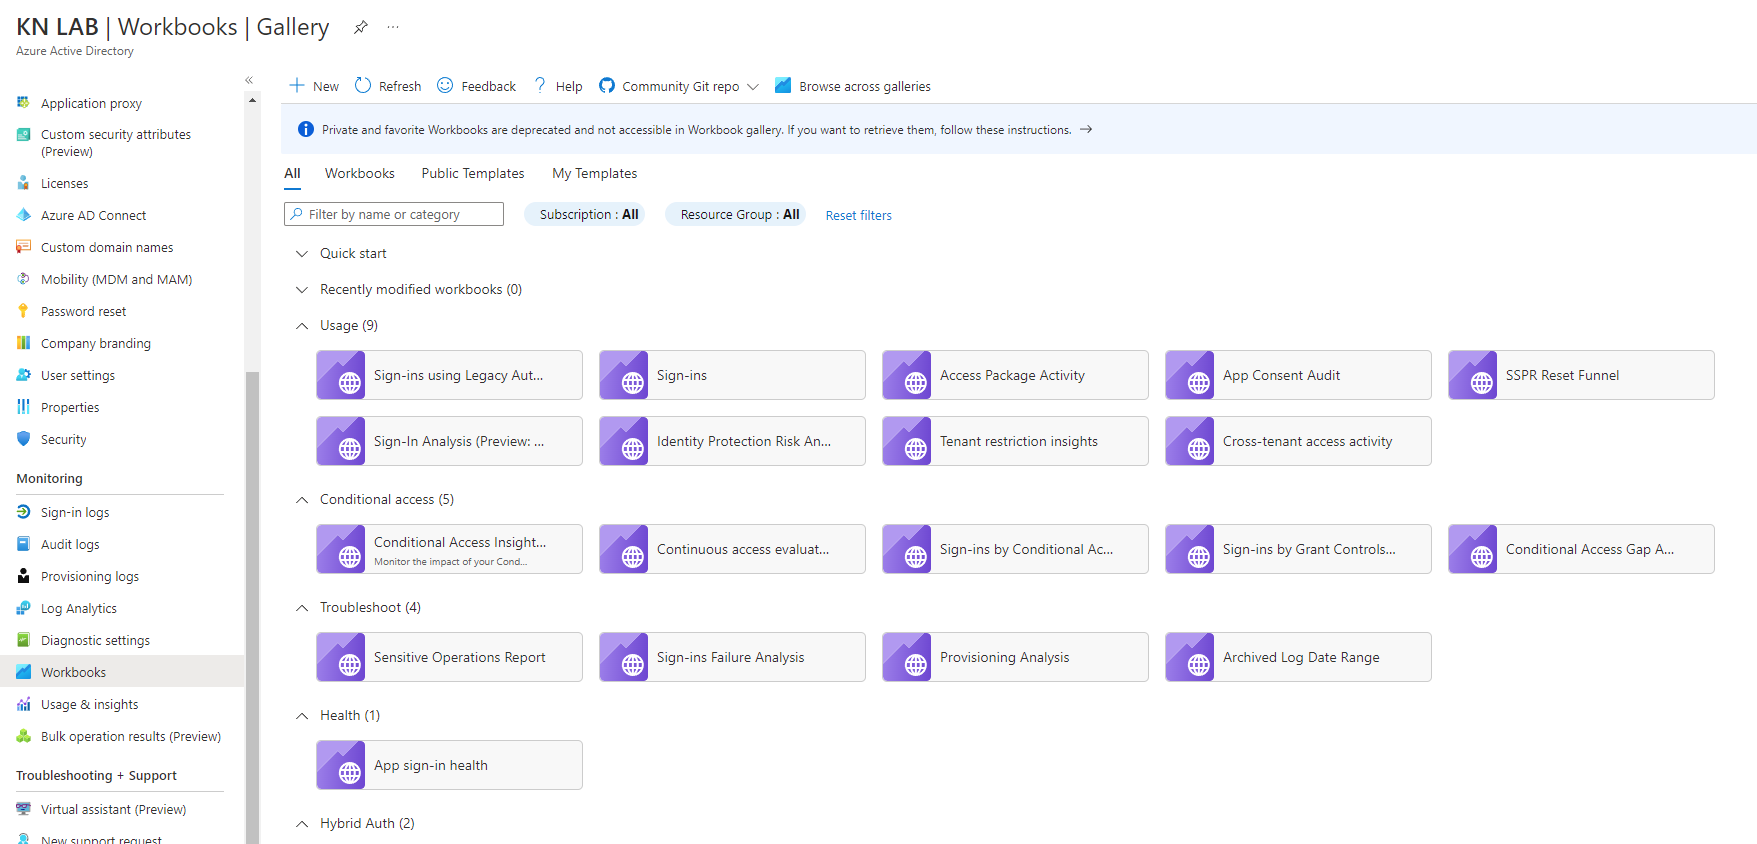
Azure AD has a good selection of built in workbooks which run off Log Analytics. Click on Workbooks on the left hand menu to access these. A selection of these is listed below. It may take a while before any data appears in your Log Analytics workbooks (generally up to 15 minutes) - you will only be seeing fresh data since you linked the data source to Log Analytics.
- Sign-ins using Legacy Auth
- Sign-ins
- Conditional Access Insights
- App Consent Audit
- Sensitive Operations Report
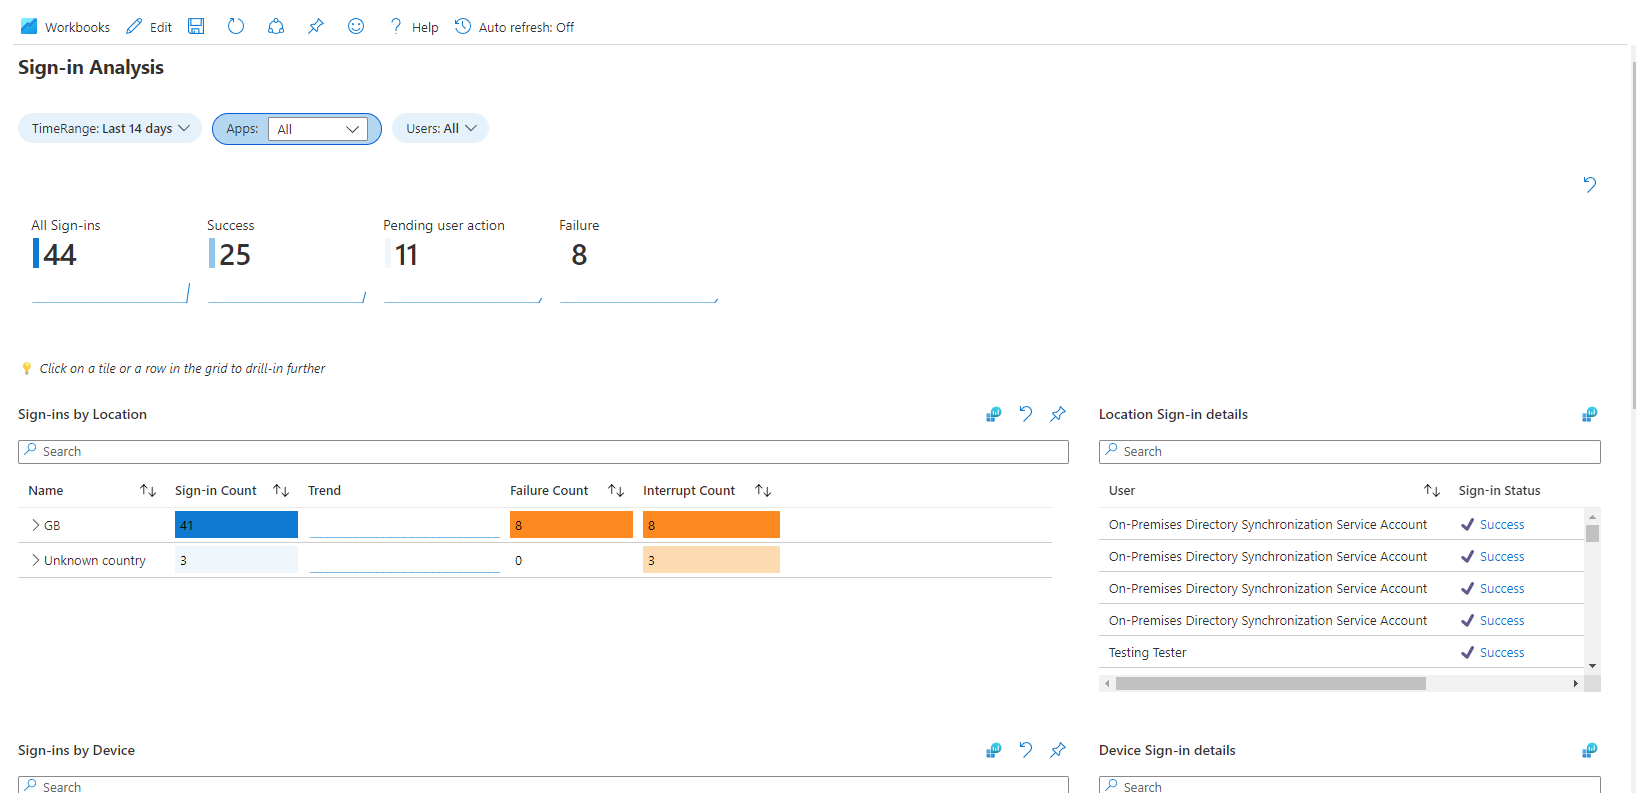
Once there's enough data logged - on a lab tenant, sign in and out of various accounts and services a few times, then wait 15 minutes or so - have a look through them and investigate what they do. For example the Sign-ins workbook is pictured below:
Querying Logs
To view and query the logs, you will need to open Log Analytics, click on your workspace and then click on the Logs page. Logs are queried using a language called Kusto Query Language (KQL). While I'll show a few example queries here, if you want to learn more about this see the Microsoft Docs.
When you first open Logs you will get a welcome screen and then be shown the Queries screen. You can close both of these for now. Assuming enough data has flowed into Log Analytics from Azure AD, you should see several tables at the left hand side of the query builder. You can click on a table name to see the fields it contains. Typing just the table name into the Query and clicking Run will show you all data within from, by default, the past 24 hours.
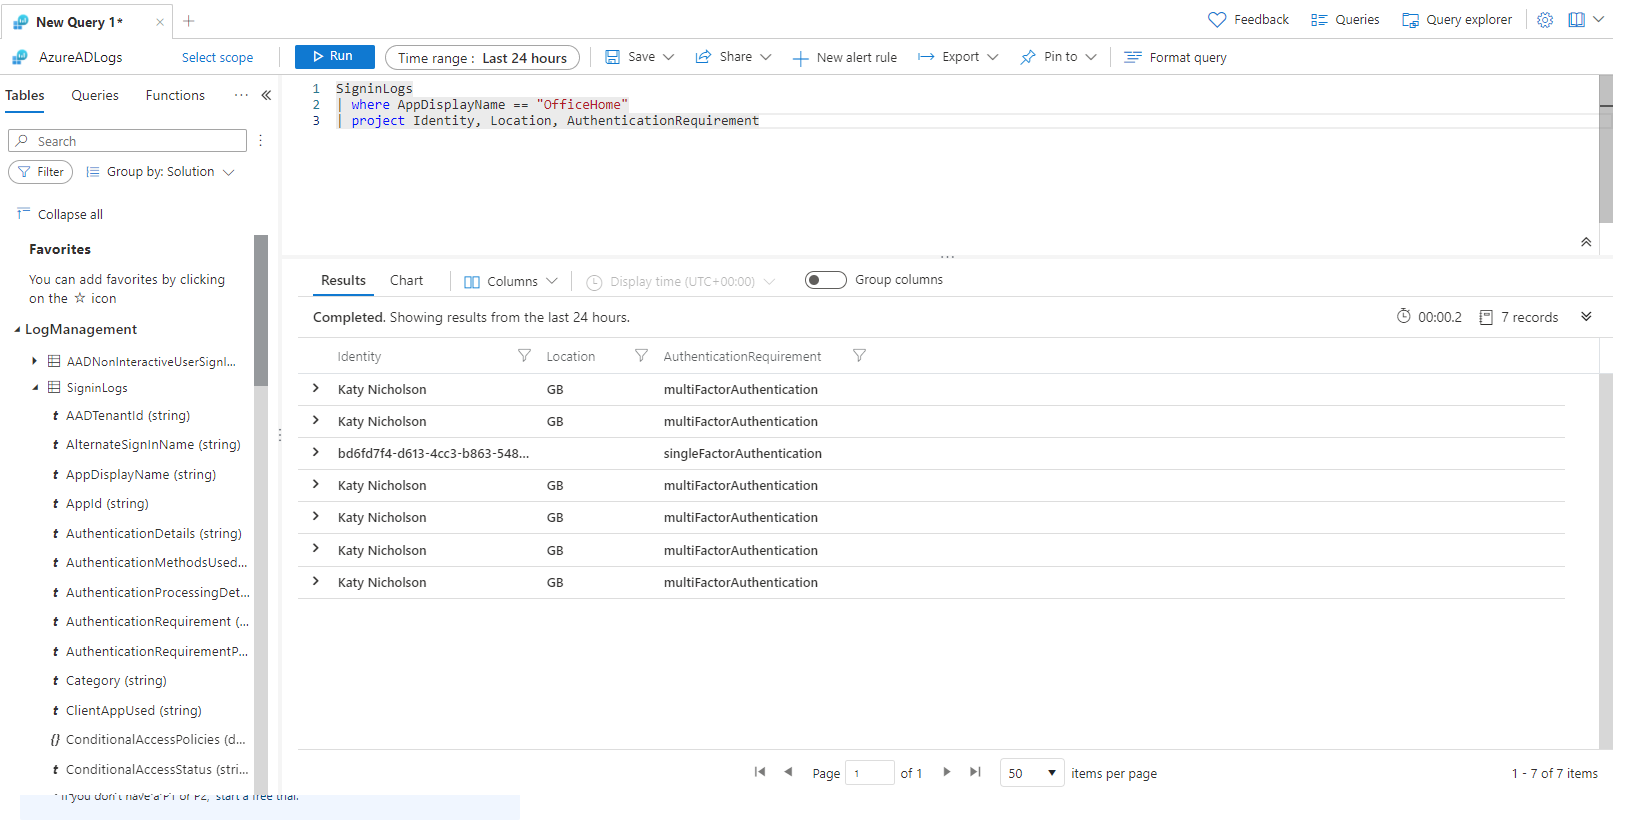
For our first query we are going to look at users signing in to OfficeHome, which is the www.office.com page, and pull specific fields. Enter the following into the query:
SigninLogs
| where AppDisplayName == "OfficeHome"
| project Identity, Location, AuthenticationRequirement
This will interrogate the SigninLogs table, and pull all rows where the AppDisplayName is "OfficeHome". It then projects just the Identity, Location and AuthenticationRequirement fields.
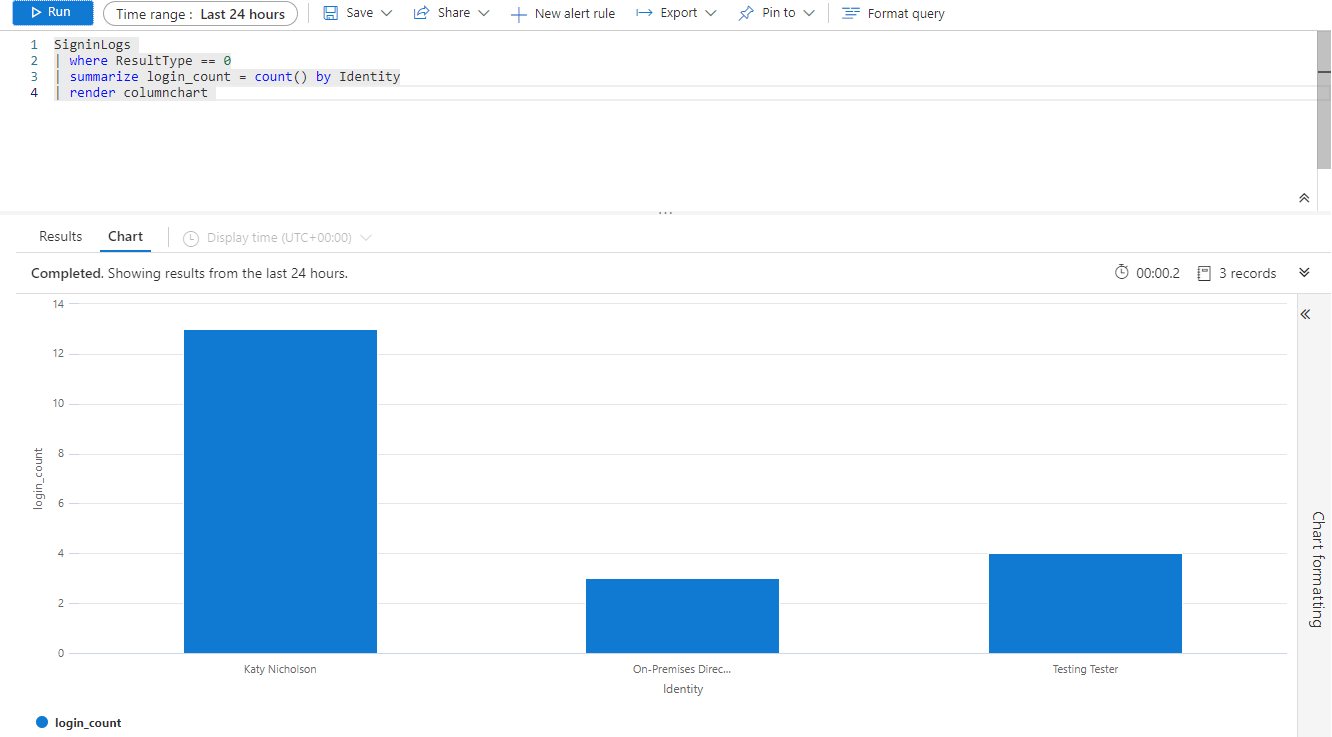
Alternatively we could produce a chart showing the number of logons for each person:
SigninLogs
| where ResultType == 0
| summarize login_count = count() by Identity
| render columnchart
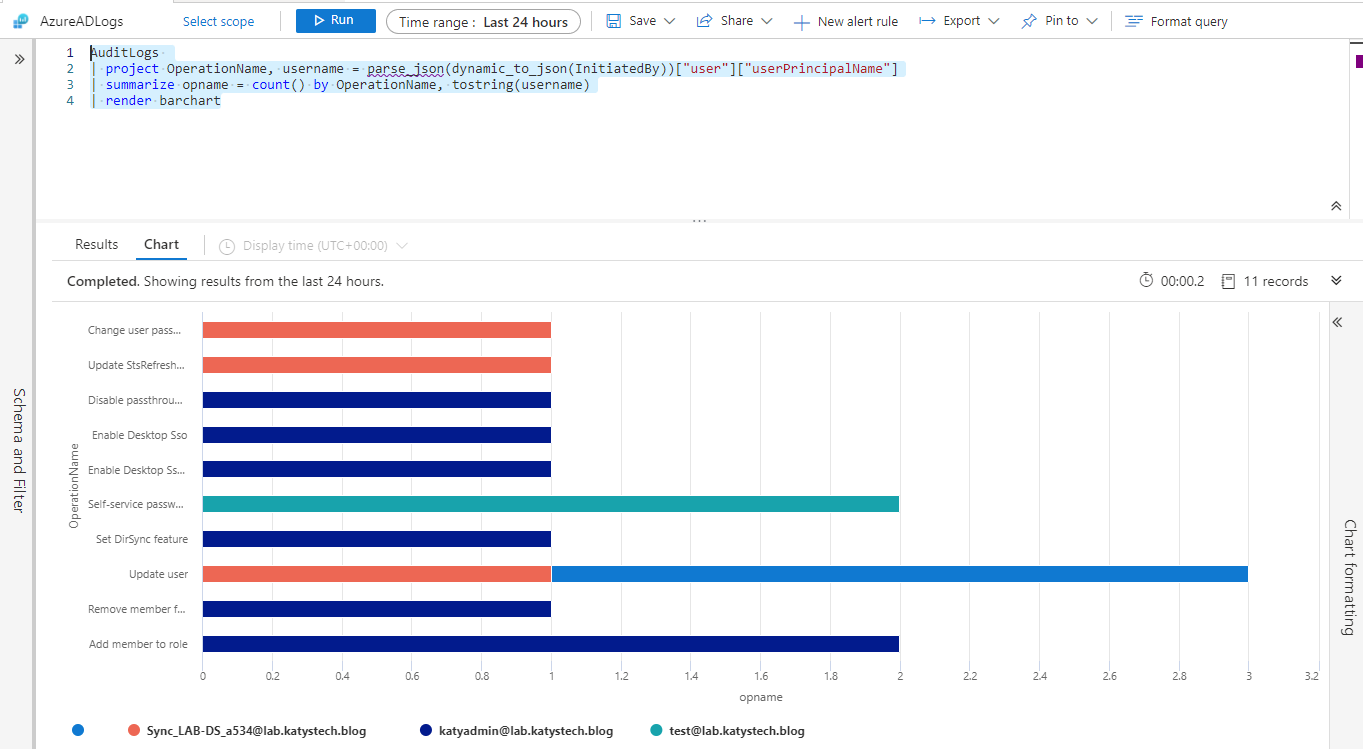
Another example query (although I wouldn't run this on anything other than a lab due to parse_json being resource intensive), this will output a bar chart showing the operation logged in the audit log (e.g. add member to role, Update user, Change password), the number of times it occurred and who initiated the operation.
AuditLogs
| project OperationName, username = parse_json(dynamic_to_json(InitiatedBy))["user"]["userPrincipalName"]
| summarize opname = count() by OperationName, tostring(username)
| render barchart
While these separate queries are useful, if we are to make full use of Log Analytics we should create a workbook.
Building a Workbook
We've already seen some of the built-in workbooks earlier in this post. Now we will create our own custom workbook. From Log Analytics, click on your workspace and then click on Workbooks. Click on New for a blank workbook.
You should be presented with a new workbook which has a sample text followed by a sample query. Each of the blocks can be edited by clicking on their respective Edit buttons.
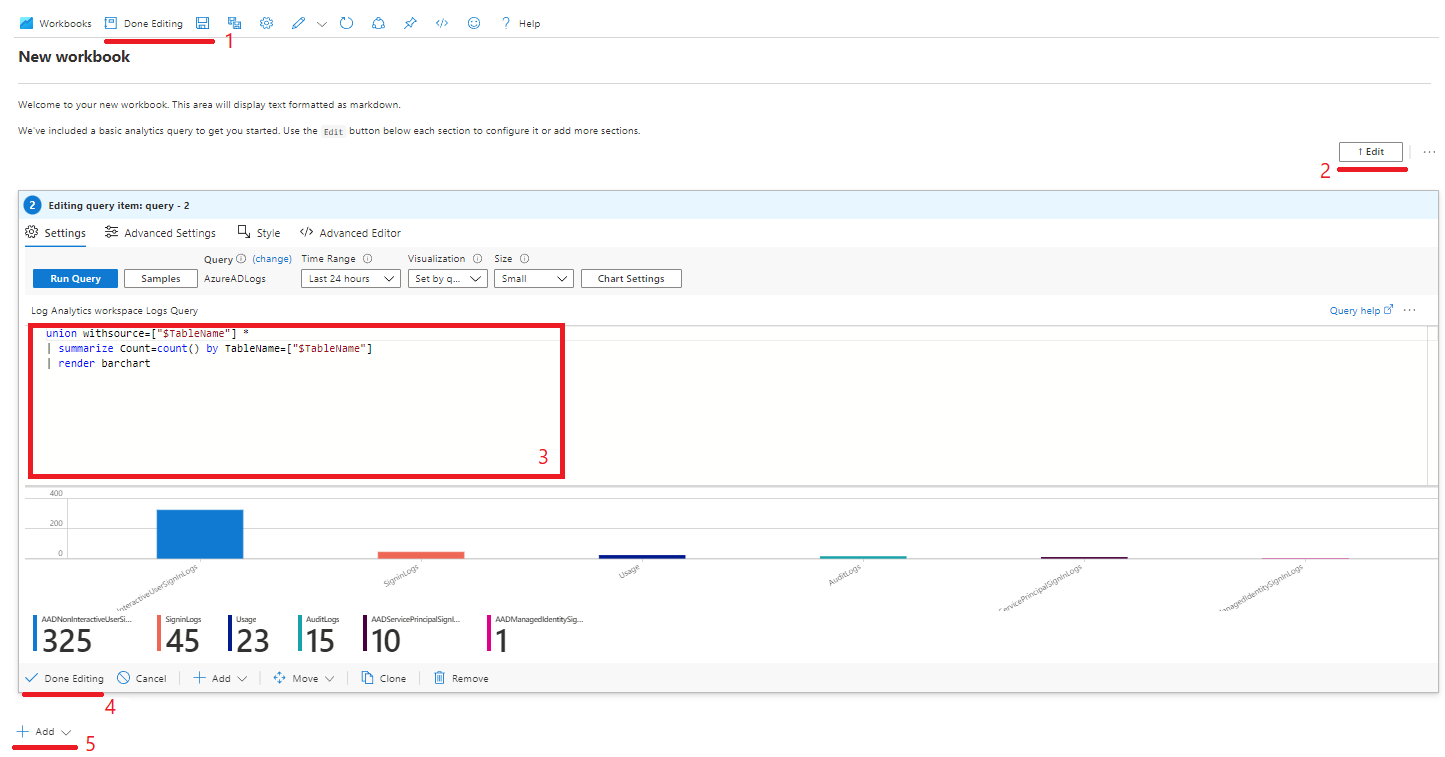
There are a few key components to this editor:
- Toolbar at the top, this is where you will toggle between edit and view mode ("Edit" and "Done Editing"), and also save your workbook.
- Edit button. Every item has an Edit button, used for editing parameters, text and queries.
- Query item's query field. This is where you will be entering the KQL query. You can preview the results by clicking on Run Query on the editor toolbar.
- Done Editing button. Every item has one, click this to close the editor view for the respective item.
- Add button. This allows you to add new items to the workbook. Items include:
- Text - used to display instructions etc
- Parameters - used to filter queries
- Query
- Group - group other items together
Edit the sample query and replace it with the following KQL which will show us a chart for all sign-ins from GB, detailing the number of sign-ins per city. Change GB to match your current location.
SigninLogs
| where Location == "GB"
| project city = tostring(parse_json(LocationDetails)["city"])
| summarize logins = count() by city
| render barchart
Now click on Run Query and make sure that it works. Click on Done Editing at the bottom of the block, then click Edit next to the sample text at the top and edit that. The text field is written using markdown, so edit it to match the below:
## Azure AD Workbook
---
My first workbook
Finally click on Done Editing and then the Save icon.

We have created a very basic workbook but there's a few other things we can do to improve it. Each query has a selection of advanced settings, including:
- Step name lets you rename "query - 2", only really shown when editing
- Make this item conditionally visible lets you show or hide the query item based on a parameter
- Show Export to Excel button when not editing will add a button so the user can export the data to Excel
- Chart title
- No data message shows a custom string when there are no results returned
- No data message style sets the styling for the above message - Info/Upsell/Success/Warning/Error.
To improve our workbook a little we are now going to add a parameter and set a couple of those advanced properties. Go back into edit mode by clicking on Edit, and click on Add at the bottom left of the workbook, then Parameter. Fill out the new parameter as follows:
- Parameter name Location
- Display name Location
- Parameter type Drop down
- Get data from Query
- Query SigninLogs | summarize by Location
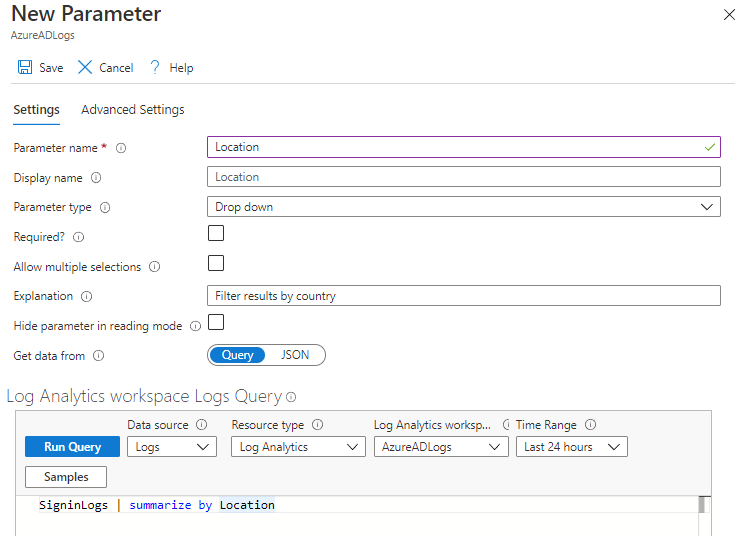
Now at the bottom of the parameters item block, click Move Up to move this above the query item. Finally click Done Editing on the parameters item. Now click Edit on the query item block, and update the query to match the following:
SigninLogs
| where Location == "{Location}"
| project city = tostring(parse_json(LocationDetails)["city"])
| summarize logins = count() by city
| render barchart
By changing "GB" to "{Location}", we are telling the query to use the parameter we just created in the query. Now click on Advanced Settings. Tick Make this item conditionally visible, and enter the Parameter name "Location", Comparison "not equal to" and leave the Parameter value at "not set". Click Save to add the condition, then give the chart a title, and click Done Editing. Finally click Done Editing on the top toolbar to return to the workbook in view mode. You should now be able to select a country from the Location drop-down and the chart will filter accordingly.

Now we're going to add another parameter, so edit the parameters item block and add a new parameter:
- Parameter name TimeRange
- Display name Time Range
- Parameter type Time range picker
- Required yes
- Available time ranges Tick the ones you want to include, e.g. last 30 minutes, last 24 hours, last 7 days, last 30 days.
Save the parameter, then in the Editing parameters item box set the default value on the Time Range drop down to 24 hours by selecting it from the list. Then click Done Editing.
Now edit the query item, and change the Time Range drop-down field to select your parameter named Time Range. Click Done Editing on the query item, then Done Editing again on the top toolbar.
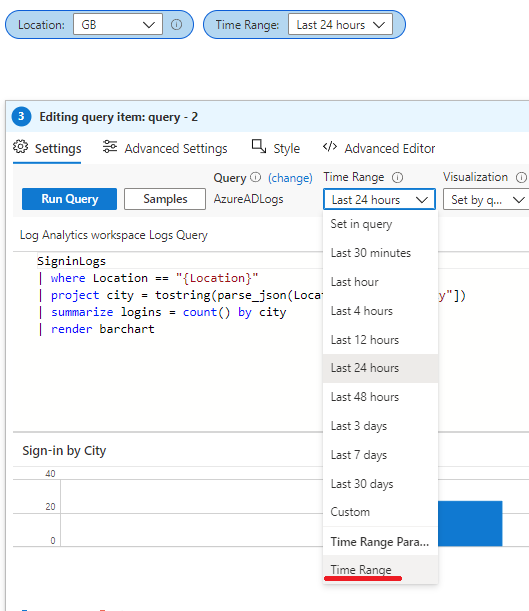
Hopefully you can now work your way around the Log Analytics workbook editor, so these next steps won't go into quite as much of a "click here, click here" level of detail. Edit the workbook again, and add a group item. In the group's Advanced Settings, set a title such as Sign-in Errors. Go back to the group Settings and add a new parameters item within the group, and create 2 parameters:
Parameter 1
- Name ErrorName
- Display name Error Name
- Parameter type Drop down
- Allow multiple selections yes
- Limit multiple selections yes, maximum 1 item
- Get data from query
- Query SigninLogs | where ResultDescription != "" | summarize by ResultDescription then click Run Query
- Include in the drop down tick 'All'
- Select All value *
- Default selected item All
We have set this parameter to allow multiple selections, and then limited to 1 item, in order to expose the 'All' element.
Parameter 2
- Name ErrorTimeRange
- Display name Error Time Range
- Parameter type Time range picker
- Required yes
- Available time ranges select a variety of times
As before, set the default time range to Last 24 hours, then close the Parameters editor and add a new query:
SigninLogs
| where ResultType != 0
| summarize Error = count() by ResultDescription
Set the time range for this query to our 'Error Time Range' parameter, and then in Advanced Settings, set the query to be conditionally visible with the condition ErrorName equals '*'. This query will show us a list of sign-in error descriptions along with the number of times they were encountered, and is only visible when the Error Name parameter is set to All.
Add a second query below, still within the group. This query will show us which users received the errors, when the ErrorName parameter is set to a specific error.
SigninLogs
| where ResultType != 0
| where ResultDescription == "{ErrorName:label}"
| summarize by Identity
Again select the Time Range to be the ErrorTimeRange parameter, then in Advanced Settings set the Chart Title to Users with error {ErrorName} and make the item conditionally visible with the condition ErrorName is not equal to '*'. Click on Done Editing on all the editors and finally on the top toolbar to view your updated workbook.
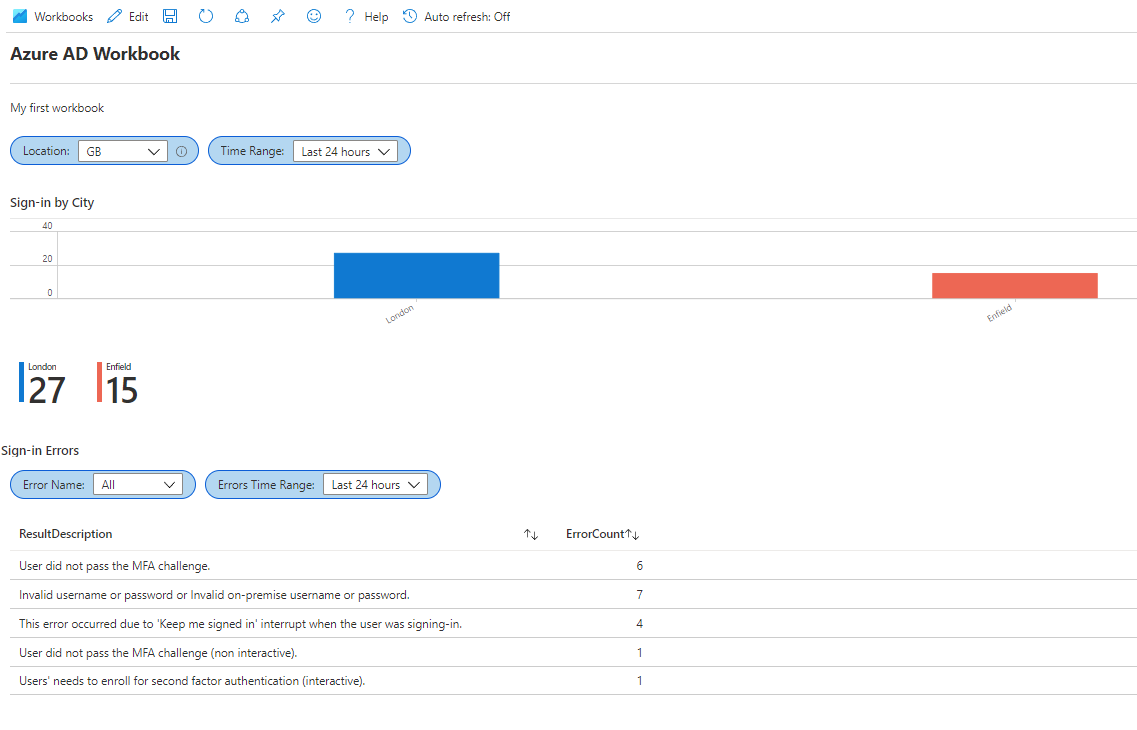
Your workbook should now look a bit like this, and you should be able to filter error types to display which users received those errors using the drop-down parameter.
Hopefully this has given you a flavour of what can be achieved with Log Analytics and custom workbooks. All of the built in Azure AD workbooks can be edited to expose how they work and how they are put together if you wanted to adapt an existing one, or just learn more about how they work.
Further Reading
In this post
- Introduction
- Configure Log Analytics
- Built-In Workbooks
- Querying Logs
- Building a Workbook
- Further Reading
Support My Work
I hope you find my content useful. Please consider tipping to support the running costs of hosting, licensing etc on my Ko-fi page.


