Endpoint Analytics

I've been looking at ways to get performance data for all our devices, currently 99% in Config Manager but in the future we're expecting to have quite a large deployment which is only managed by Intune. I've already set up Desktop Analytics but this just covers things like Windows 10 feature updates, which is good but not really what I was after.
Introducing Endpoint Analytics.
This is part of Intune and, if you set up tenant attach or device co-management, you can pull data for ConfigMgr managed devices into the console. Endpoint Analytics will show you a score, based off various factors such as startup performance, recommended software and application reliability, and there's various screens you can look at with more detailed information such as startup performance and application reliability. Most report lists can be exported for offline analysis in Excel. I think it's a key tool for identifying devices which need attention - whether it's a device that has missed its upgrade from HDD to SSD sitting at the top of the "slowest boot up time" list, or a device which frequently suffers from bugchecks/BSODs potentially being a hardware issue, it brings to light troublesome devices which the end user may not have ever reported.
I'll cover setting it up and then look at each section in turn, with lots of screenshots.
Endpoint Analytics can be found in Endpoint Manager Admin Centre > Reports > Endpoint analytics although I've got it set as a browser favourite in Edge for quick access.
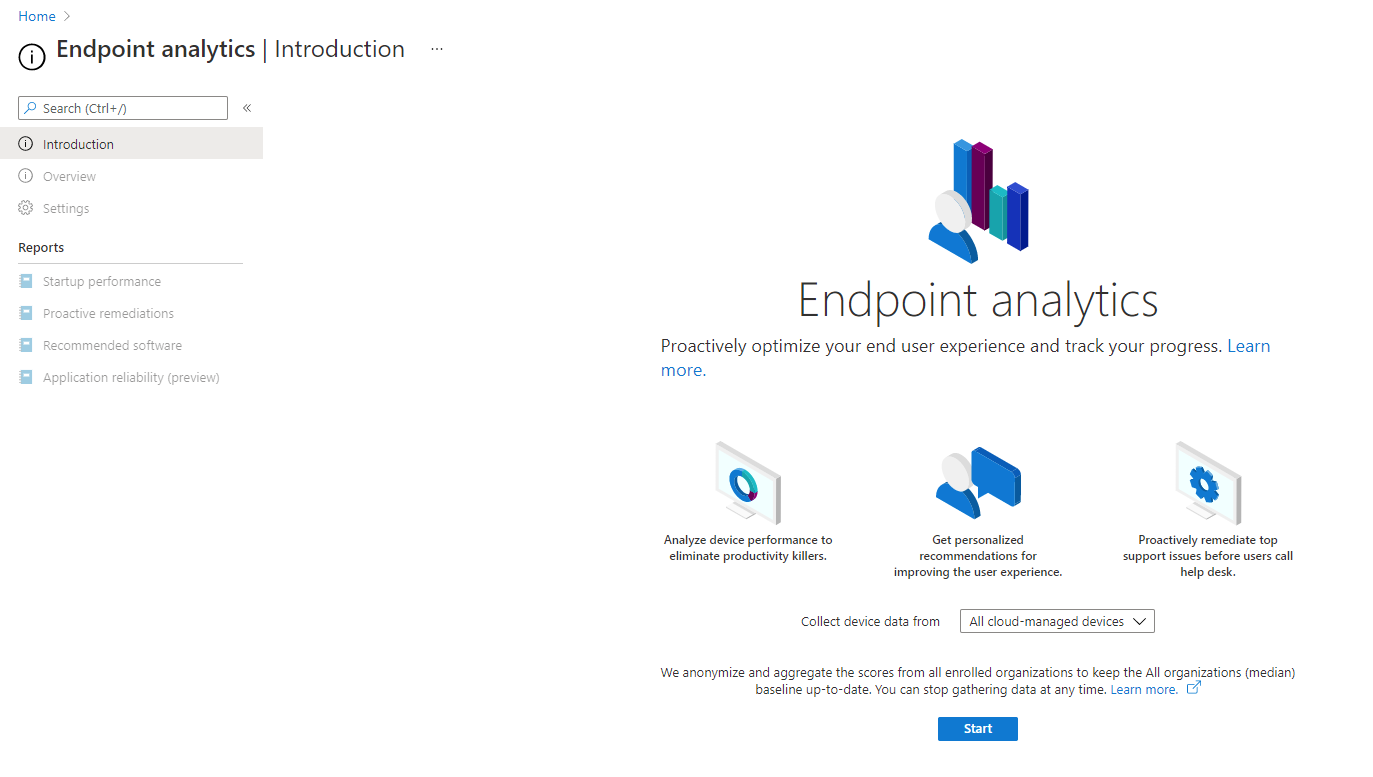
On your first run you'll see the above screen - click on Start to turn on the feature. If you just want to see data for devices enrolled in Intune, you're done. Otherwise, for ConfigMgr data, you'll need to set up co-management/tenant attach if you haven't already done so - full details of this available on the Microsoft Docs here: Microsoft Endpoint Manager tenant attach - Configuration Manager | Microsoft Docs
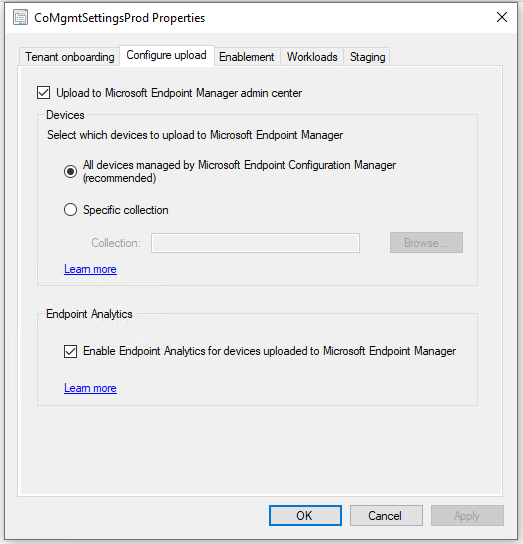
Once you've got co-management enabled, make sure that you've got "Upload to Microsoft Endpoint Manager admin centre" and "Enable Endpoint Analytics..." ticked in the "Configure upload" tab:
It may take a few days for data to come into the console - I left it a couple of months after setting it up as we had the majority of devices off due to COVID school closures. Once you've got some data you should see something similar to the below screenshots.
Overview
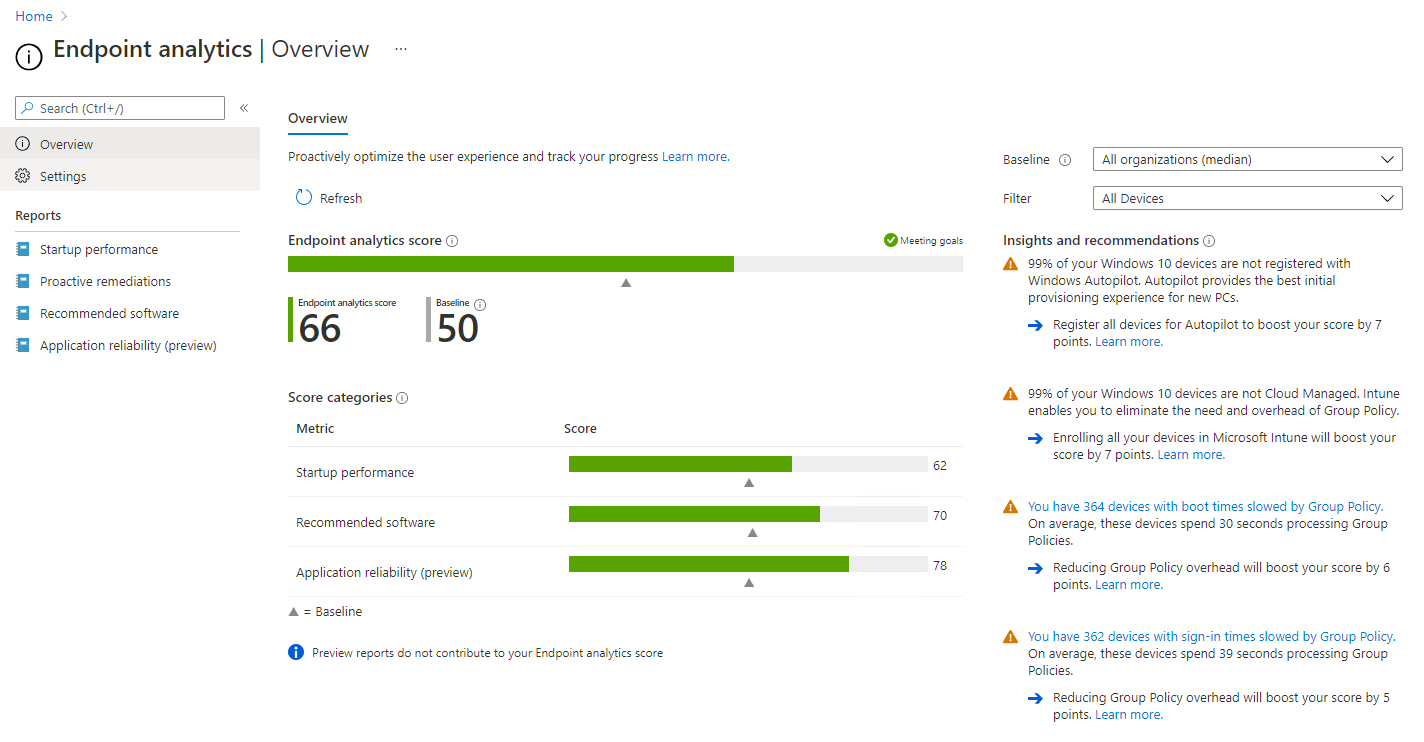
The overview shows your endpoint analytics score, which is made up of three categories:
- Startup performance: Includes things like boot speed and logon speed
- Recommended software: Split into 4 categories, Windows 10, Cloud Identity, Cloud Management and Autopilot
- Application reliability: Includes data such as application crash frequency and device crashes.
Startup Performance
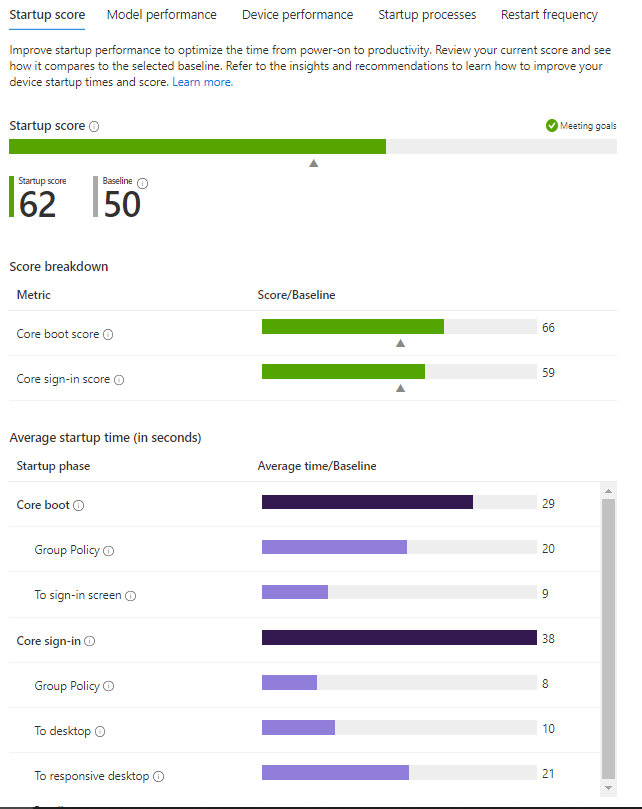
Moving onto the first report, startup performance has 5 tabs. The startup score will show you the score split into boot and sign-in, along with the average boot and sign in times. If you've got the majority of your devices on a traditional Windows AD domain you will notice a lot of prompts/recommendations about how much Group Policy slows your device down and telling you to switch to Intune for management.
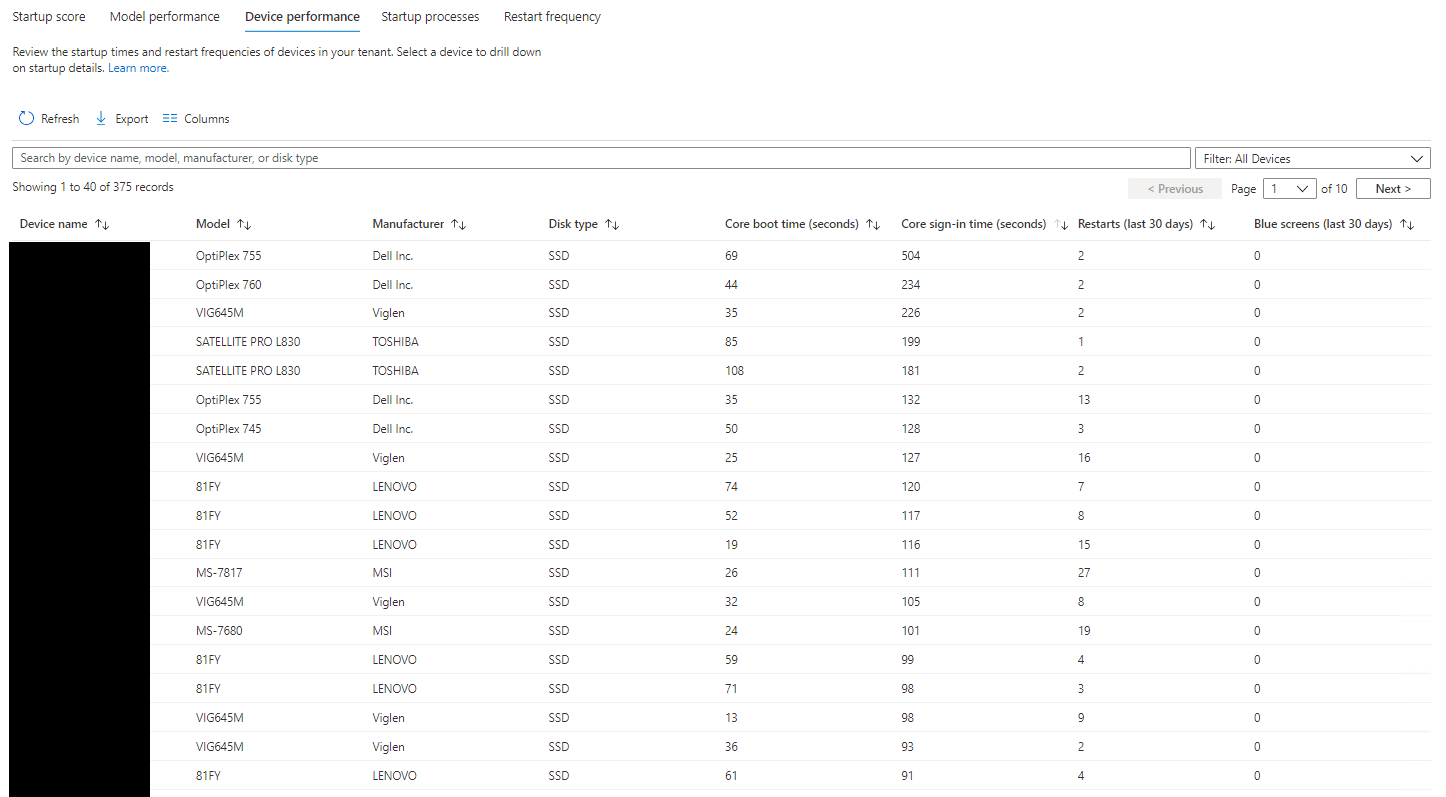
The next two tabs show performance grouped by device model, and also by individual device. This will show you the device disk type, core boot time, core sign-in time, number of restarts in the last 30 days and number of blue screens in the last 30 days.
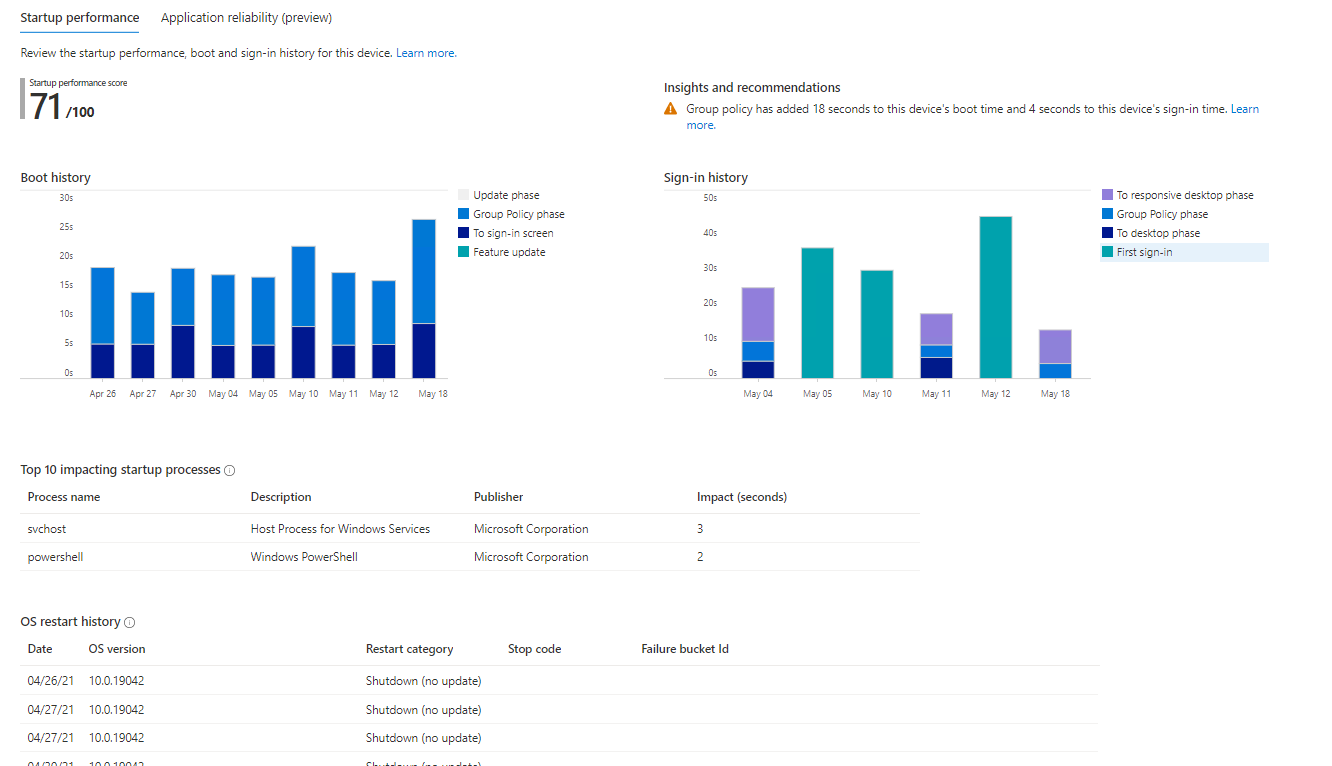
Clicking onto an individual device will let you see some detailed statistics for that device - including boot and sign-in history for the past week, which processes are impacting startup and a restart history.
The Startup Processes tab is good for seeing what is running on start up and how long it's taking, this will show process name, description, publisher, device count, median delay and total delay.
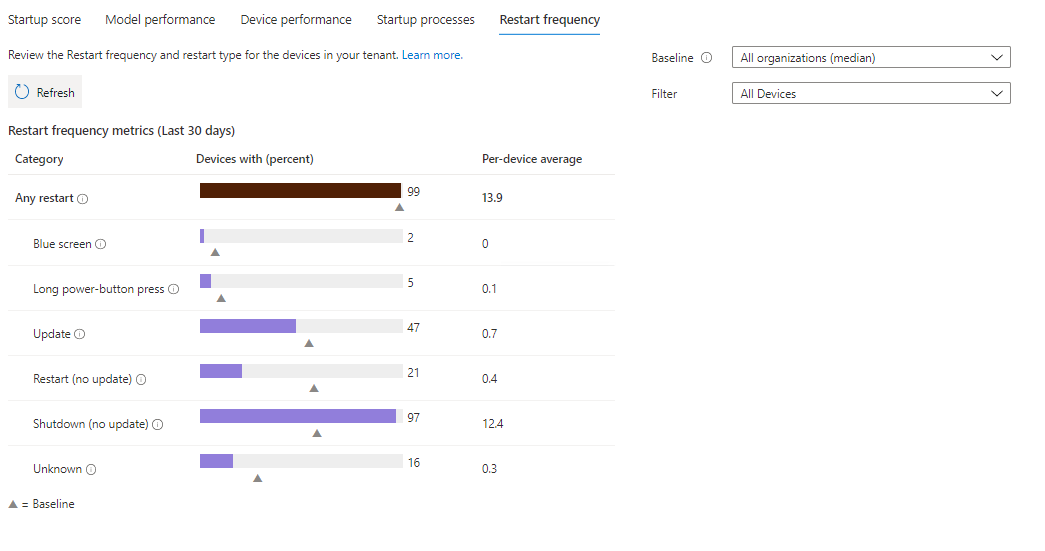
Restart Frequency shows how often, and why, devices are restarting. Whilst there's a dropdown for Filter it just contains "All Devices" on my tenant so presumably filtering is coming soon, or needs some configuration elsewhere.
Proactive Remediations
Proactive remediations allows you to create and run script packages on endpoint devices. There are a couple of built in ones:
- Restart Office Click2Run Service if it's stopped
- Update Group Policy if the last update was more than 7 days ago
You will need Windows 10 Enterprise E3/E5 or Education A3/A5, or Windows Virtual Desktop Access E3/E5 licences for the managed devices. You can read more about creating and running remediation scripts on the Microsoft Docs.
Recommended Software
This section shows the percentage of your devices which have:
- Windows 10 installed
- Cloud Identity (they are registered in Azure AD, including hybrid joined devices)
- Cloud management (Enrolled in Intune, this doesn't include ConfigMgr clients)
- Autopilot
Application reliability
Application reliability is, at the time of writing, in preview however I'd say it's the most powerful part of endpoint analytics. In this section we can see which devices are having issues with applications crashing and which applications have a tendency to crash.
App Reliability Score will give you an overall score, along with details of which applications are frequently having issues based on the past 14 days.
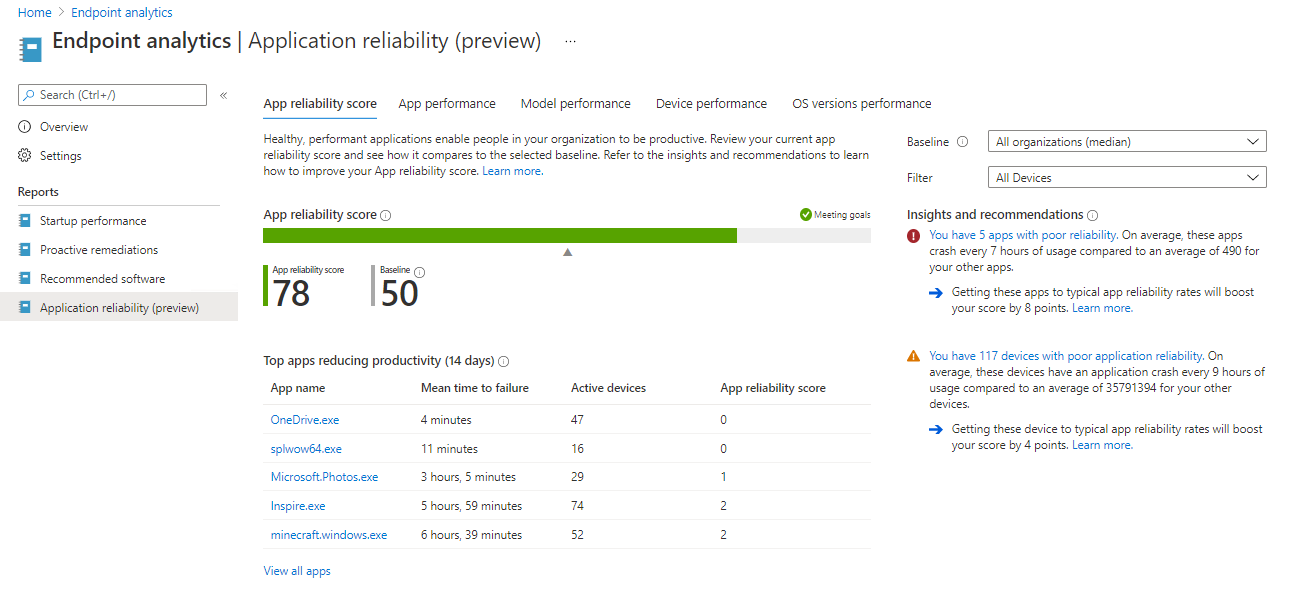
App performance shows you the application name, publisher, number of active devices, usage duration, number of crashes, mean time to failure and an app reliability score. All data is based on the past 14 days. Again you can click on an individual app to view the versions in use.

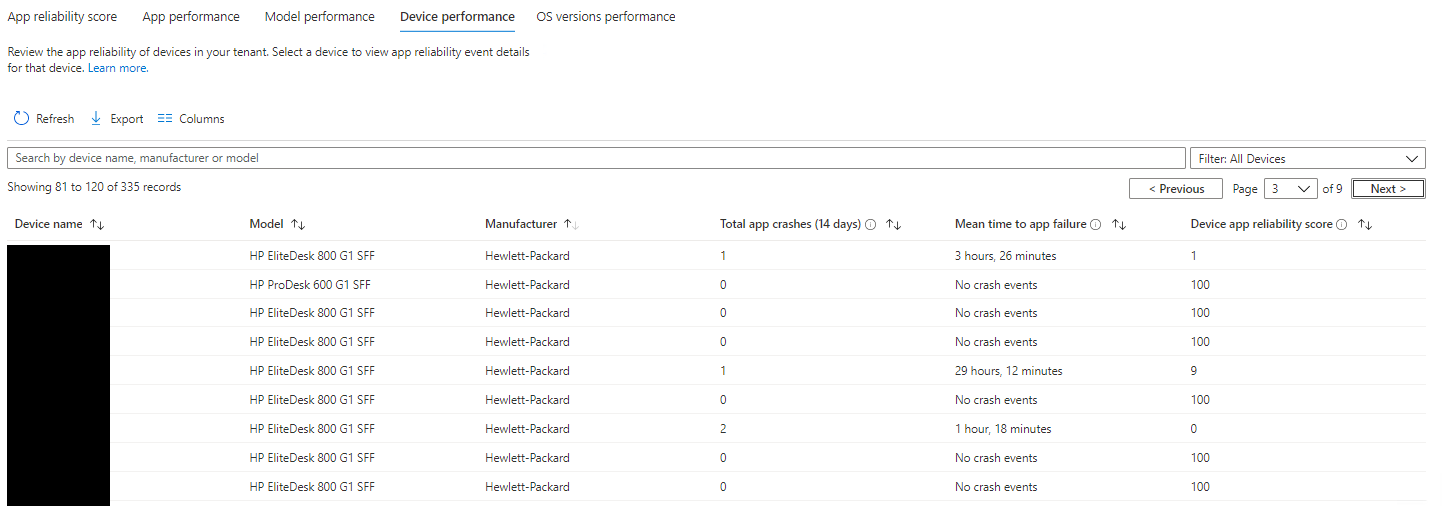
As with the Startup performance report, Model performance is essentially the same data as Device performance, but grouped by device model. Under device performance we can see crashes per device, and order by total app crashes to highlight the least reliable devices for investigation.
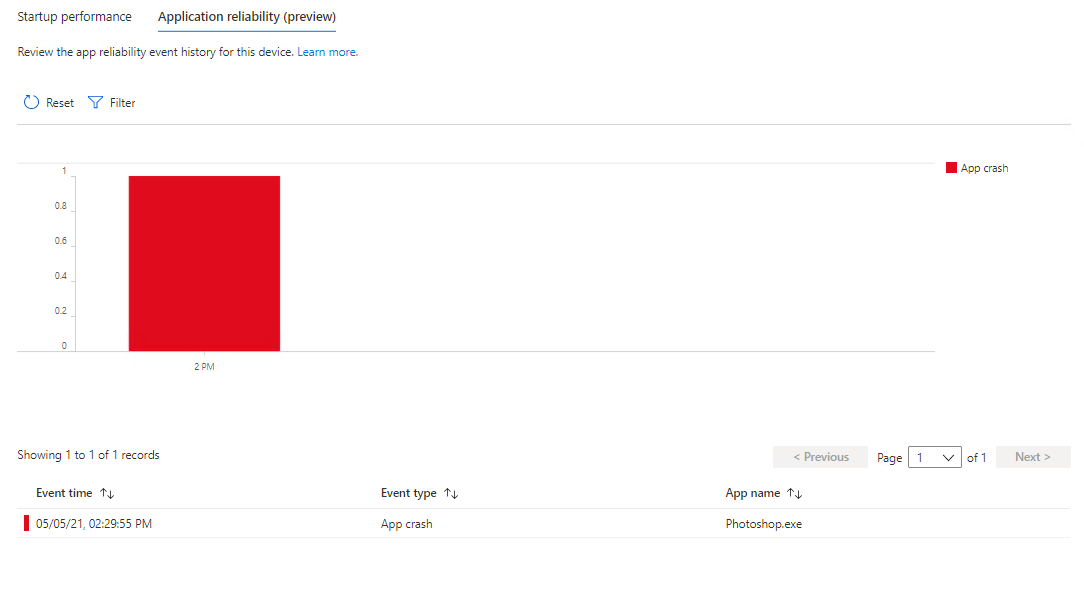
Clicking on an individual device in the list will bring up the history of application crashes for that device, in this case Photoshop.exe has crashed twice.
Endpoint Analytics is a useful tool in troubleshooting and finding application versions, or devices, with frequent problems for investigation and I look forward to how it might expand in the future.
Further Reading
In this post
- Introduction
- Overview
- Startup Performance
- Proactive Remediations
- Recommended Software
- Application reliability
- Further Reading
Support My Work
I hope you find my content useful. Please consider tipping to support the running costs of hosting, licensing etc on my Ko-fi page.


