Analysing BSOD Memory Dumps

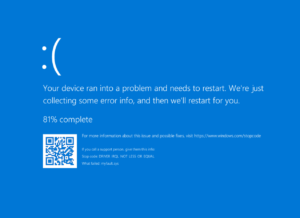
We had re-imaged all devices to Win 10 Edu 2004, after testing everything worked in a couple of rooms. All good, then the first day with teachers back and we get multiple calls about computers crashing with BSOD while the interactive whiteboards are being used.
Whilst the user reported multiple crashes, when I went in person I wasn't able to cause it to crash so couldn't just look at the "What failed" bit on the Win 10 BSOD screen.
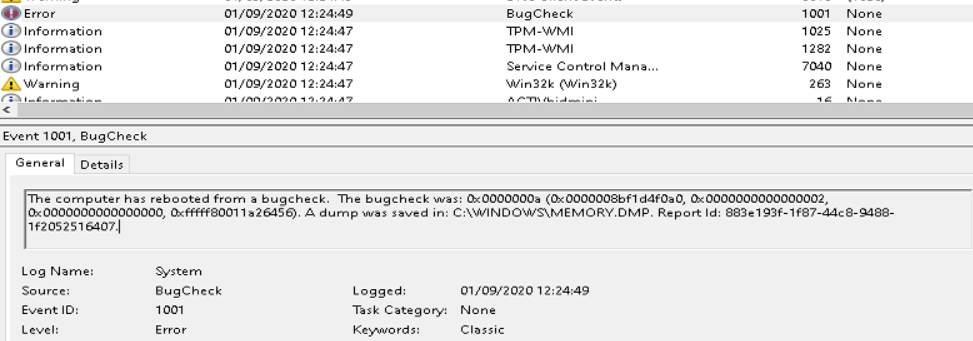
A quick look at the system event log on one of the computers in question shows nothing useful - just "the computer has rebooted from a bugcheck". You can get the error code here too but no pointer as to what actually caused this.
In my case, the error was 0xA which we can look up here to see it's the dreaded IRQL_NOT_LESS_OR_EQUAL which is something to do with drivers and memory.

The usual troubleshooting steps here don't prove much help - I've not installed any new software or hardware (besides the Windows release), and everything worked fine on Win 10 Edu 1909. Luckily when a system crashes, by default it creates a mini memory dump at C:\Windows\memory.dmp and we can analyse this file to see what caused the crash in the first place. Copy the memory.dmp file to somewhere you can work on it, I have a secondary drive on my PC for things like this.
You'll need to install the Debugging Tools for Windows (WinDbg) - you can do this on your workstation, doesn't have to be on the crashing PC. Once installed you should find WinDbg (X64) in the Start Menu. If not, by default it's in C:\Program Files (x86)\Windows Kits\10\Debuggers\x64\windbg.exe.
There's also a Windows store version of this called WinDbg (Preview). The process is basically the same whichever version you use, the store app has a more modern interface but I'll cover the traditional Win32 application version here.
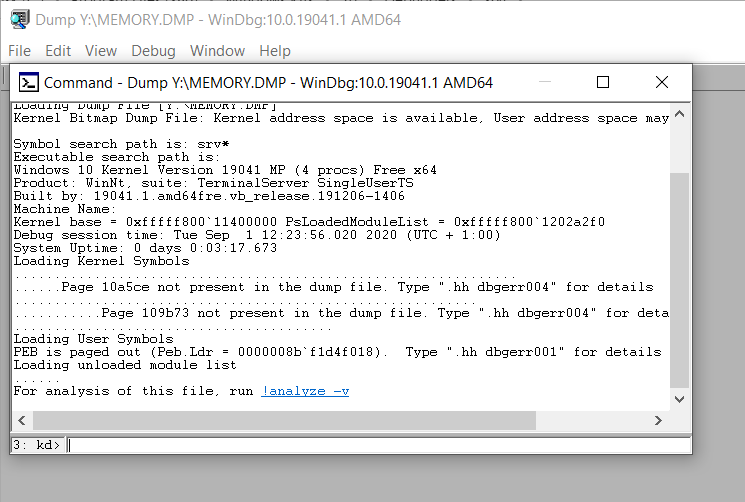
Open WinDbg, then go to File -> Open Crash Dump and find the memory.dmp file.

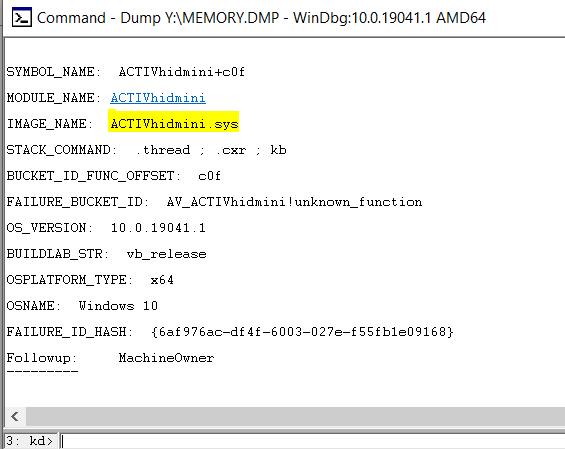
Next step is to just do as it suggests - type in !analyze -v and hit Enter. This will take a few seconds to analyse the file and will start by showing you a description of the crash (which we've already looked up ourselves on the list of bugcheck codes). Nearer the end it should show the driver at fault - I've highlighted it here:

In my case ACTIVhidmini.sys relates to Promethean ActivDriver, which is used to connect to their range of interactive whiteboards. Updating the driver to the latest version hasn't solved the issue so we have had to revert to Win 10 1909 on the teaching PCs.
I've had the same problem in the past in one specific room, where we hadn't changed anything at all, and it pointed at the same driver. In that case there was a hardware fault with the interactive board, swapping it out stopped the PC from crashing again.

